Your trades already know where your money goes. Pro shows you.
The free plan gives you a clean journal and the core numbers. Pro reads the same trades from every angle that changes a decision: which hours pay, what each mistake costs, how your state shows up in your results, and how close a prop account is to the edge. Here is each view, what it shows and what it is worth.
A card starts the trial. Nothing is charged for 14 days, and you can cancel before it bills. Something not working? Write to us: we answer within 30 minutes, every day.
Hours, sessions and weekdays
What you see: Your average R and money by opening hour, by session and by weekday, best and worst marked.
Why it pays: Most traders have one or two hours that pay for everything and one that quietly gives it back. You cannot feel it; you can see it.
Example: A trader finds +1.4R a trade at 09:00 and −1.3R after 16:00. Stopping new entries after 16:00 alone turns a flat month into +11R.
The cost of every mistake
What you see: Each mistake tag with its count, its money and its win rate, against your clean trades, and the equity line you would have had without them.
Why it pays: A mistake you can put a price on is a mistake you stop making. The most expensive one is rarely the one you would guess.
Example: Moved stops: 6 trades, −$412 in a month. The clean trades win 61% of the time; the ones with a moved stop win 17%. That is the first rule to write.
Your state, against your results
What you see: Sleep, energy and mood from a three-tap check-in, and calm at entry, set next to what the day's trades did.
Why it pays: Tired days and tilted entries cost money long before you notice. The charts show the pattern in your own data, as association, not as a lecture.
Example: On mornings rated 2 or lower, the trader takes twice the trades and loses 0.6R a trade. The rule: on a low morning, half size or no trades.
R distribution and consistency
What you see: The spread of your results in R, each day of the month as a bar, and month by week.
Why it pays: It tells you whether your edge is real or rides on two lucky trades, and which days undo your weeks.
Example: Without its two biggest wins, the month is −2R. One day at −1.6R wiped out four good ones. Both are things to fix, and neither shows in a total.
Prop firm limits and warnings
What you see: Daily loss, maximum drawdown and the profit target as bars that fill as you trade, the risk of open stops counted in, and a warning on the form before a trade breaks a rule.
Why it pays: Most evaluations fail on one bad day, not on a bad strategy. Seeing the room left before the order is placed saves the account.
Example: Down $3,800 on a $5,000 daily limit, the next trade risks $1,000. The form says it before you send it: this trade can end the evaluation.
Economic calendar and market hours
What you see: This week's releases in your own time zone with forecast and previous, and every forex session and exchange on one straight line: open, closed, and when that changes.
Why it pays: Most bad fills happen around news and at the open. Knowing what lands when, before you are in a trade, is the cheapest edge there is.
Example: An alert 15 minutes before US CPI: you close the EURUSD position or move the stop before the spike, instead of finding out from the fill.
A good week that two late entries nearly gave back: +3.1R over 9 trades.
What worked
- London breakouts carried the week.5 trades, +$640, +3.9R
- Every trade had a stop before entry.9 of 9 trades
What cost you
- Late entries after 16:00 cost the most.2 trades, −$310, −2.1R
Next week, work on
- No new entries after 16:00 on weekdays.
- Keep the London breakout size; it is working.
An AI reading of your past trades, not investment advice. It can be wrong, so check it against your numbers.
AI reviews of your week and your trades
What you see: Every week, what worked, what cost you and one thing to work on, each line with its trades and R. Any trade can get a second look, and you can ask about your numbers in plain words.
Why it pays: A review you would not have time to write, from your own data, in a minute. The math is SetupBook's; the model only reads it.
Example: "A good week that two late entries nearly gave back: +3.1R over 9 trades. Next week: no new entries after 16:00."
Sync, import and your whole history
What you see: MetaTrader 4 and 5, cTrader, Oanda and the exchanges (Bybit, Binance, OKX, Bitget, BingX, MEXC, KuCoin, Hyperliquid) send your trades by themselves; files import in a minute; every trade and every account, for as long as you trade.
Why it pays: A journal you have to type is a journal you stop keeping. With sync it fills itself, and the numbers above stay true.
Example: Connect MT5 once and every deal arrives within seconds, stops and targets included, on every account in one view.
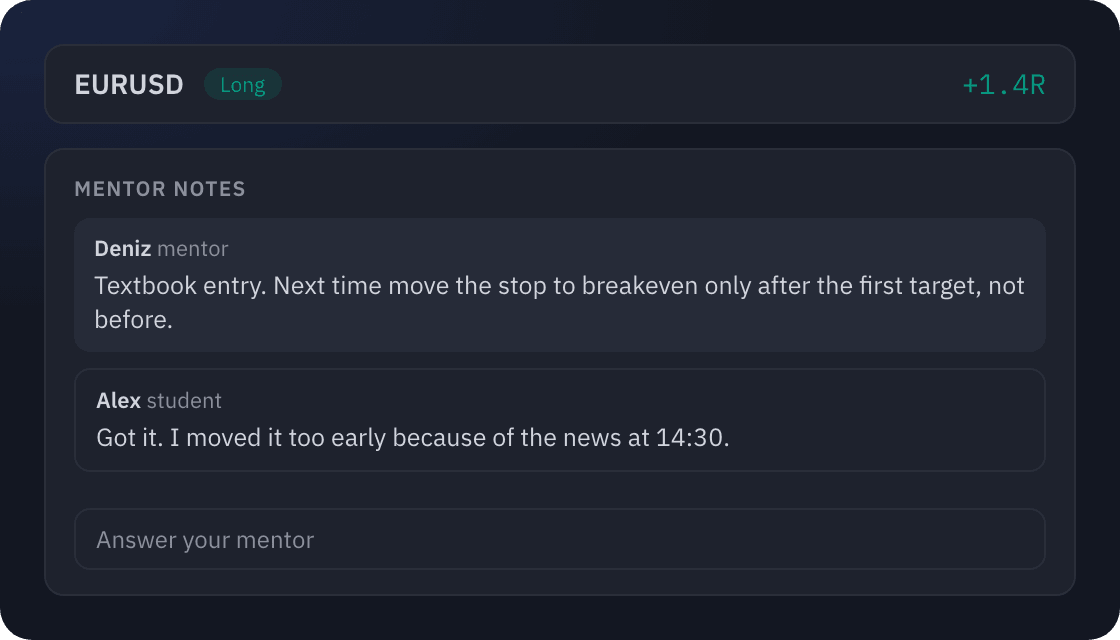
Mentor mode
What you see: A coach or a friend reads your journal, read-only and only what you share, and leaves notes on a trade or a day.
Why it pays: Another pair of eyes sees the habit you have stopped noticing. Notes stay next to the trade they are about.
Example: "Textbook entry. Move the stop to breakeven only after the first target." One note, on the trade itself.
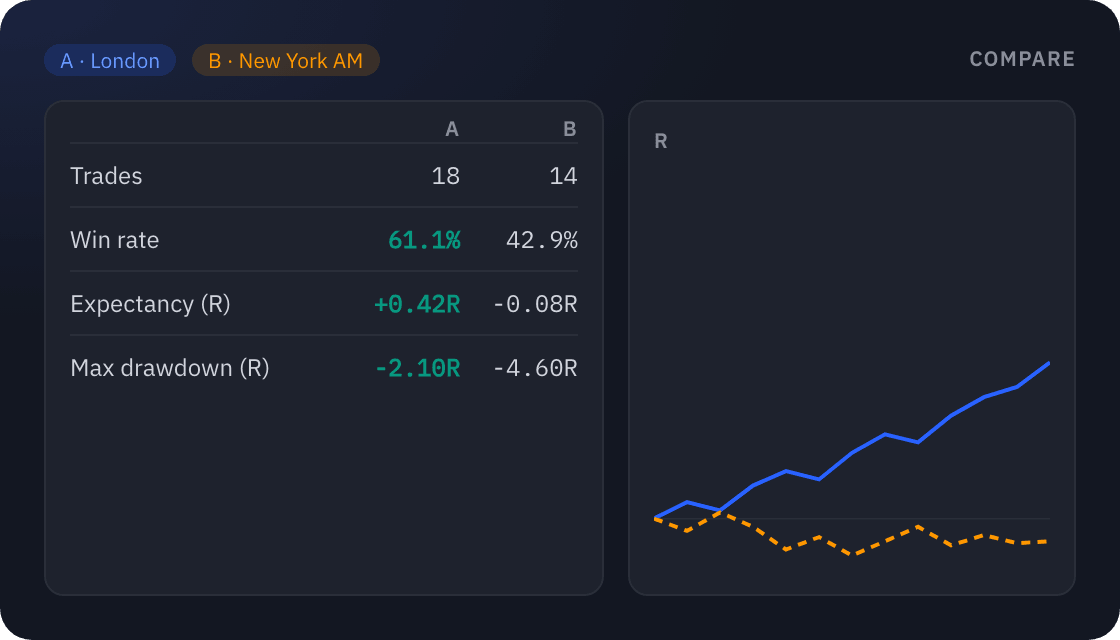
Saved views and A/B compare
What you see: Your filters saved under a name, and any two of them side by side: win rate, expectancy, drawdown and both R curves.
Why it pays: Most of what a journal teaches is a comparison. Here it takes ten seconds.
Example: London against New York: 61% against 43%, +0.42R against −0.08R a trade. The plan for next month writes itself.
PDF report
What you see: A clean report of a week, a month, a year or any days you pick: the numbers, the curve, the breakdowns.
Why it pays: For your review, your mentor or a prop firm application, in one file.
Example: October, one page: +18R, 62% win rate, the best setup and the most expensive mistake.
Try it on your own trades
Every view above opens the day you start. Use it for 14 days on your own journal, then keep Pro or stay on the free plan with everything you logged.
Start 14 days free